Correlating application logs and resource utilization using the ELK stack
Intro
Sometimes when running an application in production it’s useful to correlate events from different sources (e.g. application logs with resource utilization data). This can be useful for instance to discover requests that take a disproportionate amount of resources. In this post we explore how to implement this in practice using the ELK stack. The full source code is available for those of you that want to dig deeper.
Setting up the data pipeline
To collect resource utilization data we’ll use dstat and expose the data through a web interface:
$ curl -s localhost:8888|python -m json.tool
{
    "cpu": {
        "hiq": "0",
        "idl": "99",
        "siq": "0",
        "sys": "0",
        "usr": "1",
        "wai": "0"
    },
    "disk": {
        "read": "0",
        "writ": "0"
    },
    "memory": {
        "buff": "340M",
        "cach": "5469M",
        "free": "2644M",
        "used": "11.3G"
    },
    "net": {
        "recv": "108B",
        "send": "74B"
    }
}
We can poll this information periodically and send it to the ELK pipeline (Logstash is listening for input on port 5000):
$ while true; \
> do curl -s localhost:8888 | \
> python3 dstat.py | \
> jq '.' -c -M | \
> nc localhost 5000; \
> sleep 1; \
> done
At this point we’re successfully collecting resource utilization data. The next step is to collect the application logs. To simulate a real application we’ve created a toy Go application that burns CPU for a configurable period of time:
func spin(period int) {
    b, err := json.Marshal(Message{fmt.Sprintf("Spinning for %d secs", period)})
    if err == nil {
            shipToLogstash(append(b, []byte("\n")...))
    }
    now := time.Now()
    end := now.Add(time.Duration(period) * time.Second)
    doSpin := func() {
            for time.Now().Before(end) {
            }
    }
    for i := 0; i < 8; i++ {
            go doSpin()
    }
}
We can trigger that function by making an HTTP call like this:
$ curl 'localhost:8080/?period=10'
When invoked, the function produces the following log entry and burns CPU for the specified period of time:
{
    “Text”: “Spinning for 10 secs”
}
Correlating application logs with resource utilization
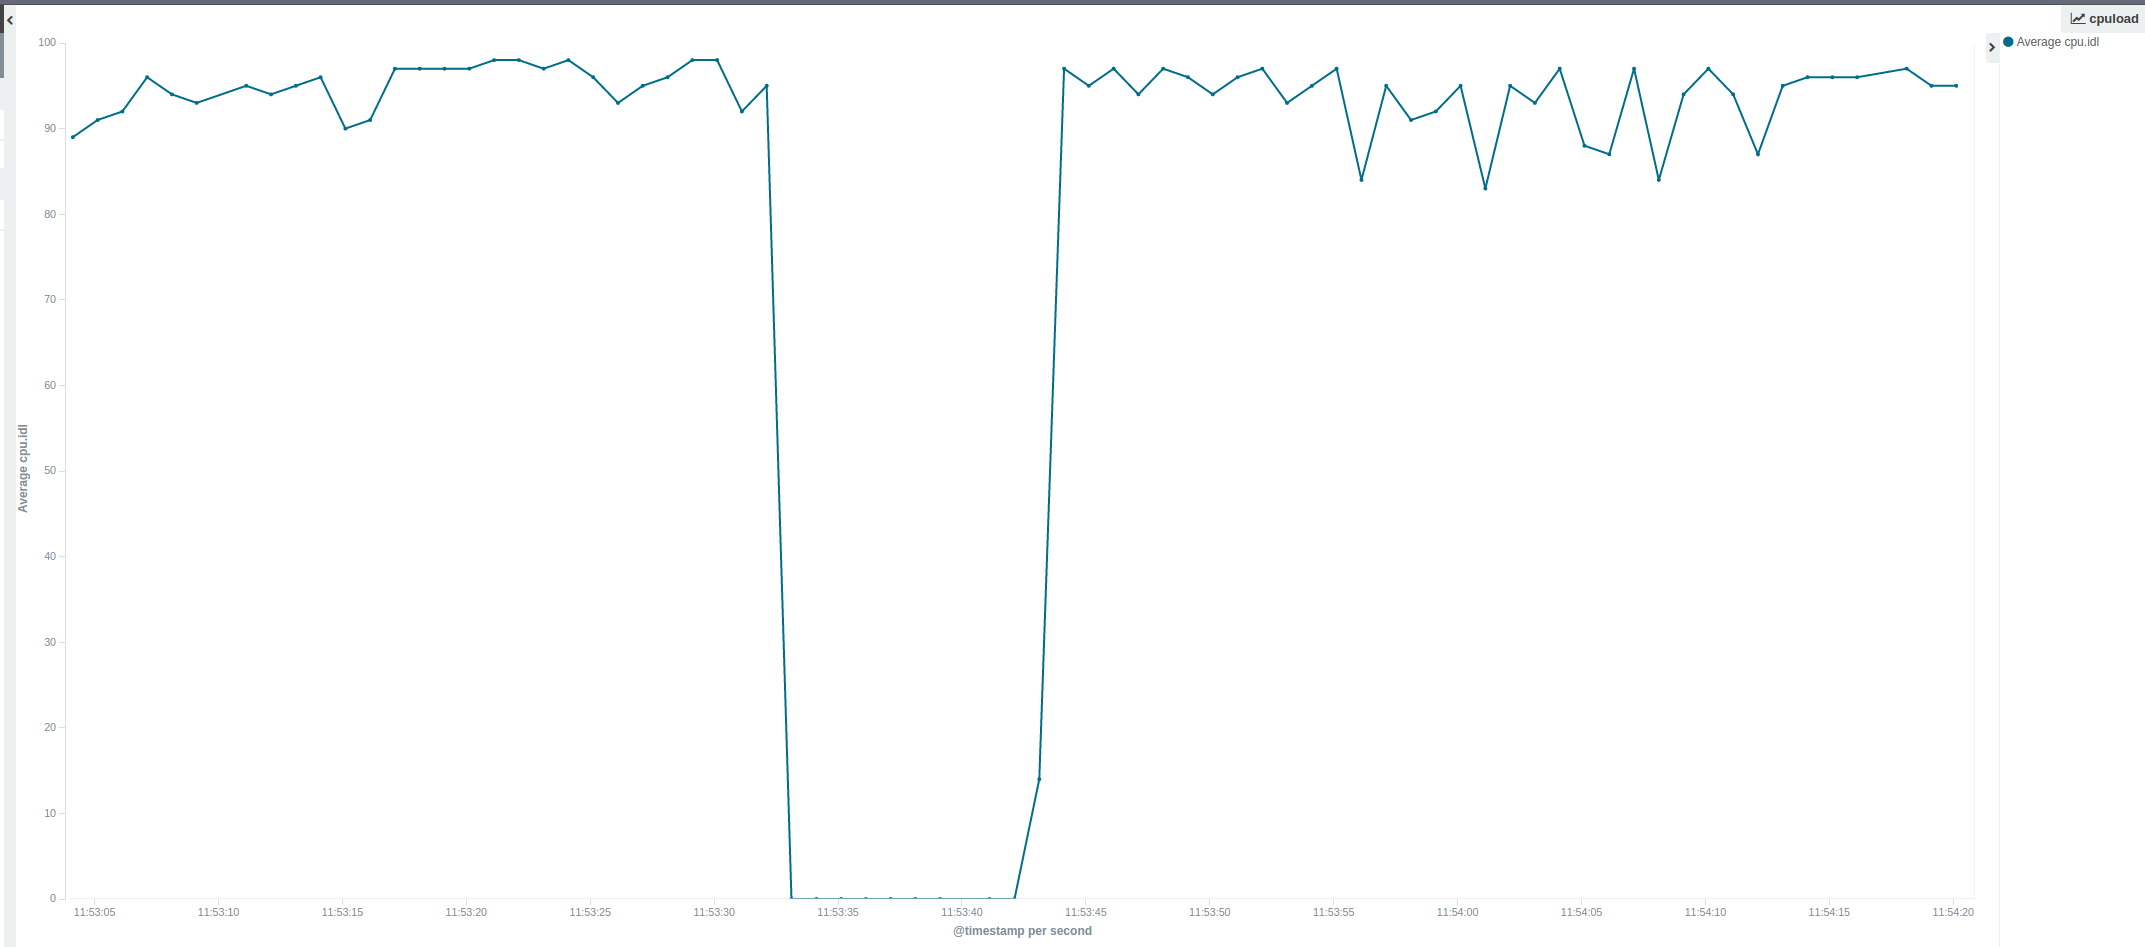
We can plot the resource utilization information we’re gathering using Kibana. During normal operation the CPU is idle between 90 and 100% of the time. However as we can see in the picture below, there’s a period of approximately 10 seconds (starting around 11:53:32) in which the CPU load increases a lot.
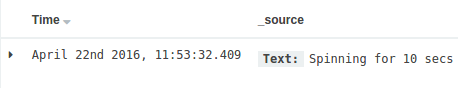
One way to start investigating the root cause of this behavior is to search the time frame prior to the load spike. We can easily do that in Kibana and after a little bit of log searching we find the culprit. As we can see in the picture below there was a request to the Go application that resulted in the load spike:
Conclusion
Having a good monitoring infrastructure is crucial to understand how your application behaves in production. In this post we’ve explored how to create it by leveraging the ELK stack. Although this post uses a toy example, we can use the same setup to gather relevant information for real applications.